


This article is part of our Football Draft Kit series.
Fantasy analysts frequently advise against drafting a quarterback early. Should owners listen?
That question, and others like it, boils down to a problem of scarcity. The reasoning behind waiting to draft a quarterback is that good or serviceable options are comparatively abundant. Therefore, the logic continues, early picks should target elite running backs and wide receivers, which are less common.
Are good quarterbacks actually abundant? And just how scarce are elite running backs or wide receivers? If you wait to draft a quarterback, how long should you wait? As owners weigh these questions, are they correctly calculating the costs and benefits?
To answer those questions and make better draft decisions, we need a clear understanding of the actual scarcity of each position.
Grasping Fantasy Scarcity
It's important to understand fantasy scarcity on two levels.
First, the weekly level. How many points does a great, good, average, etc., running back score in a typical week, and how many running backs match each description? In addition, we need to understand the significance of the drop from one tier to the next — not just know where the drop occurs. For example, does a good wide receiver outscore the average by two points or five? For an advantage of only two points, we might prefer to invest in another position; a five-point margin between tiers is a much bigger motivator.
Second, we need to know how frequently a player is good, average, etc. For example, maybe the best running backs in a week
Fantasy analysts frequently advise against drafting a quarterback early. Should owners listen?
That question, and others like it, boils down to a problem of scarcity. The reasoning behind waiting to draft a quarterback is that good or serviceable options are comparatively abundant. Therefore, the logic continues, early picks should target elite running backs and wide receivers, which are less common.
Are good quarterbacks actually abundant? And just how scarce are elite running backs or wide receivers? If you wait to draft a quarterback, how long should you wait? As owners weigh these questions, are they correctly calculating the costs and benefits?
To answer those questions and make better draft decisions, we need a clear understanding of the actual scarcity of each position.
Grasping Fantasy Scarcity
It's important to understand fantasy scarcity on two levels.
First, the weekly level. How many points does a great, good, average, etc., running back score in a typical week, and how many running backs match each description? In addition, we need to understand the significance of the drop from one tier to the next — not just know where the drop occurs. For example, does a good wide receiver outscore the average by two points or five? For an advantage of only two points, we might prefer to invest in another position; a five-point margin between tiers is a much bigger motivator.
Second, we need to know how frequently a player is good, average, etc. For example, maybe the best running backs in a week outscore the mediocre ones by a large margin, but no running back ranks in the top group more than a quarter of the time. If that is the case, no matter how large the gap between tiers, it is probably not worth paying a premium for a top-tier running back.
Once we have developed our understanding of positional scarcity — on both levels — for each skill position, we can compare them to inform a draft strategy.
Task 1: Scarcity of Scores by Position
First, focusing one week at a time, we will break down the scoring tiers within each position and the comparative frequency of each tier. For example, the best quarterback scores each week reach at least 26 points — but how many quarterbacks reach that total, and how far behind is the next group of scorers?
For this part of the analysis, we will treat each week as its own independent trial. In a sense, for this part of the study, we are thinking more like a DFS manager than owners in a seasonal league. For now, we don't care what anyone did the week before or after. We are trying to understand how many points are needed for a great tight end performance, for example, and how that compares to a mediocre or bad tight end game. Later, we will pay attention to players like Jordan Cameron, who was a nightmare for fantasy owners — he scored 15.9 PPR points in Week 2 last year, but only totaled 11 yards in two games the rest of the season. For this portion of the analysis, we just want to know how rare or common it is for a tight end to score 15.9-ish points in any given week.
Task 2: Scarcity of High Scorers by Position
After finishing the weekly analysis for each position, we will look at how frequently players reside in each tier. This is where Cameron's one shining moment comes in. Cameron had one strong week and two terrible weeks. For every player who appeared in the top few tiers at his position, we will look at how often they produced at each level.
We will probably find that some positions (cough, tight ends) experience frequent variation — that is, individual players will fluctuate between very good, average and very bad. Extreme variability, if that's what the data shows, would be a big mark against drafting the position early.
Task 3: Comparing Scarcity Across Positions
In the final portion of this analysis, we will compare the breakdowns from position to position. This will allow us to use the analysis to generate actionable fantasy advice.
(A Word About Data)
QUARTERBACK
Fantasy quarterbacks have the highest floor of any skill position. Quarterbacks scored less than six fantasy points only 23 times (min. three attempts) in the first half of last season, an average of 2.9 per week.
Taken as a group, QB scoring resembles what statistics calls a "normal curve" — a distribution that looks bell-shaped on a graph. In a normal distribution, the farther a score is from the average, the less frequently a player scores that total.
Quarterback scoring isn't a perfectly normal distribution (it has a bit of a "right skew" to it), but it is close enough to normal for our purposes.
If we were to actually graph this, you'd see that not every week saw the exact same breakdown, though things were generally similar week to week. There were almost always more scores in the 12- to 16-point range than anywhere else, and the more extreme the score, good or bad, the less frequently it occurred. As the extreme scores were graphed, the distribution would completely flatten along the side.
In the first half of last season, a quarterback scored 26 or more points 29 times, an average of 3.6 quarterbacks per week. This is our top QB tier, the elite. This tier was reached once by seven players, twice by eight players and three times by two players (Tom Brady and Matthew Stafford).
The next tier was 20 to 25.9 points, which we'll call the "great" QB tier. Internally, this tier would look a lot like the elite tier, except that it contains more players. The internal distribution appears almost flat and includes 42 instances, averaging 5.3 per week. Combining the great and elite tiers gives us an average of 8.9 quarterbacks per week.
Below is a breakdown showing the number of times a quarterback hit each fantasy-point tier. Note the last column, which shows the number of quarterbacks who scored in that tier or better at least four times during the eight-week sample. For example, the "15" in the "good" tier means that 15 quarterbacks scored at least 16 points in half of their games.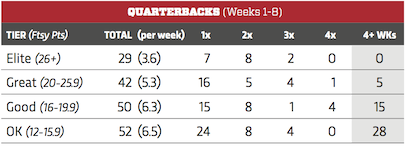
The final breakdown for quarterbacks shows some consistency. Even though, on average, fewer than nine quarterbacks per week scored at least 20 points, five individual quarterbacks were among the elite/great group at least half the time. Similarly, more than six quarterbacks per week scored in the good tier, and that group also saw four score within that small range at least half the time.
Fantasy Implications:
1. Waiting for a quarterback is the safe decision … : The most consistent quarterbacks are less consistent than the most consistent players at other positions. Furthermore, half of the most consistent quarterbacks will probably have late-round average draft positions (ADP).
2. … But a top-five QB is one of the best values in fantasy: There is one counterpoint to the "wait for a QB" argument. The difference between "great" and "good" quarterbacks is large — one of the largest between tiers across all four positions. There is a tiny number of quarterbacks who are consistently "great" or better. That combination means the best quarterbacks are both scarcer and bring a bigger yield than can be acquired almost anywhere else. Based on scarcity economics alone (i.e., ignoring strategic/roster decisions), the top handful of quarterbacks present one of the biggest competitive advantages available, and provide enough value to justify drafting in the first two rounds.
RUNNING BACK
Running backs dominate the early rounds of most drafts, and so the position is arguably the most important to understand as thoroughly as possible. Running backs are distributed more similarly to wide receivers than any position, but tight ends are closer to receivers than running backs.
Technically speaking, the running backs' distribution is probably best described as a right-skewed curve, and the distribution has, for lack of a better term, bumps in it, reflecting touchdowns. But those bumps are not focused exactly on multiples of six, especially in PPR. Determining the cause of this offset would take a whole other article, but the offset does make the tiers designation for running back the most meaningful.
To look at the tier breakdown among running backs, we must look at PPR and standard scoring separately. 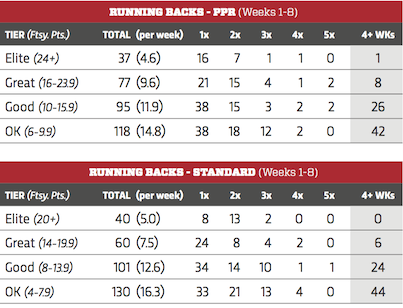
What jumps off the page is how much more consistent running backs are than the other positions. A large number of running backs frequently produce at a great or better level. The great tier is approximately the mark of an RB1 — and six players reached that mark in standard scoring during half the weeks of our sample. In PPR scoring, players reached the top tiers even more frequently.
At the bottom of the charts, we see a cautionary, yet unsurprising trend. A huge number of running backs hit the "OK" level more than half the time (42 in PPR, 44 in standard). But far fewer (26, 24) achieved that degree of consistency reaching the "good" tier.
Fantasy Implications:
1. Top-tier RBs are the ideal fantasy commodity: Technically, there are fewer "great" or better quarterbacks than "great" or better running backs. But since fantasy teams start more than twice as many RBs (including the flex spot), running backs are effectively scarcer. More important, the difference between "great" and "good" running backs is the biggest difference between adjacent tiers across all four positions. In PPR, a "great" running back can score as many as eight points more than a "good" one, and another six points more than an "OK" running back. In standard, those differences are both six points. Additionally, these high-level backs are extremely consistent. Top-tier running backs are the ideal fantasy commodity — rare, and gigantically better than the replacement options. Again, in terms of scarcity economics, running backs deserve to be the first half-dozen-ish selections on draft day.
2. Running backs should dominate the middle rounds, too: Consistently "good" running backs are similarly common compared to consistently "good" players at other positions, but the "good" running backs have two big advantages. First, there is a bigger scoring difference between "good" and "OK" at running back than any position. Second, running backs are more consistent than any position (and that's true of all tiers).
WIDE RECEIVER
Wide receivers are distributed across what statistics calls a "right-skewed" curve. The peak of the graph, the most common values, is below the arithmetic mean (fancy math speak for what most of the world calls "average"). When drawn horizontally, the graph looks like a steep cliff on one side but a gradual slope on the other.
This is to be expected of skill position players, because unlike quarterbacks, each team uses multiple players at running back, tight end and wide receiver in every game — there is no effective minimum number of carries or targets.
In PPR, the graph peaks between two and four fantasy points, which makes sense — the average yards per completion is about 10.5, so the average completion is worth more than two fantasy points. Interestingly, the graph's tail is not an uninterrupted decline — there are small sub-peaks between 12 and 14 points, and between 18 and 20. Again there's the outsized impact of touchdowns, after 12 and 18 points, both of which are multiples of six.
Touchdowns are distributed somewhat randomly among the sample, and each touchdown is a giant six-point boost. If touchdowns are completely eliminated from scores, the graph would immediately shift into a softly sloping decline.
Below is the tier breakdown for wide receivers, for PPR and standard scoring.Due to the way the data broke out, the natural breaks for the tiers made PPR scoring more inclusive than those for standard. Reaching the elite and great tiers was more common in PPR, meaning the terms are more exclusive in standard scoring.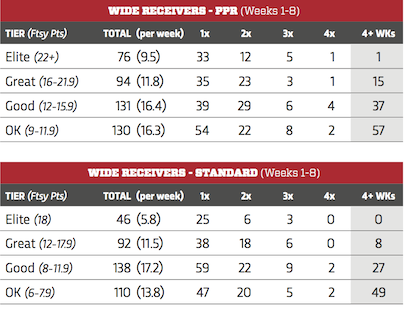
In both PPR and standard, we see big drops between the number of times a player scored in any tier once and the times a tier was reached multiple times. This might seem to reinforce the idea that wide receiver scoring is inconsistent and frequently hit-or-miss.
But look deeper, and it becomes clear that many receivers are actually very consistent. The great or elite tiers were hit many times. Some wide receivers are actually highly consistent. This information didn't fit in the table, but several wide receivers reached the "great" or "good" tier six times. That was not the case for quarterbacks nor tight ends.
Compared to quarterbacks, more wide receivers are consistent, and those consistent WRs hit their "normal" tier more often. However, the percentage of QBs who hit their tier at least half the time is higher than that for WRs. Put differently, a QB is slightly more likely to be consistent, but the consistent WRs are more consistent than the consistent QBs.
Fantasy Implications:
1. Get in on the "great" WR action: The "great" tier for wide receivers is big. "Great" receivers score a lot more than other tiers, and a lot of receivers fall into this tier, especially in PPR. However, since the "greats" are so much better than the "goods," it is important to get in on the "great" action. Don't let your opponents stockpile these assets. It will be hard to compete if every other team has two or three of these, and you have one or none.
TIGHT END
The tight end breakdown is similar to that of the wide receivers. Almost all of the differences are summarized by two "well, duh" observations — compared to wide receivers, tight ends score less and there are fewer viable fantasy options.
As was the case for wide receivers, tight ends create a right-skewed curve, with the gentle downward slope interrupted by bumps caused by the outsized impact of touchdowns. Tight end is a touchdown-dependent position, and the most important consideration when drafting one is to make sure to grab a red-zone target.
For both PPR and standard scoring, the great and good tiers have four-point ranges (i.e. 8-12, 12-16), but the standard tiers are much lower than PPR. In standard scoring, a good tight end scores barely more than any random waiver-wire option.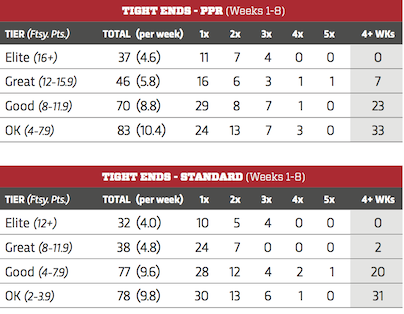
In PPR, we see a surprising amount of consistency at the top. Despite only 10.4 players per week exceeding 12 points, seven players do it at least half the time. In standard scoring, however, who reaches the top tiers is more of a mish-mash. Many standard TEs reach the top tiers more than once, but few make it a habit.
Regardless of the scoring system, a lot of tight ends consistently score at least into the good tier. This observation jives with the popularly held idea that if you don't have a top tight end, there is not much difference between the remaining options.
But the data shows that this trope needs some adjustment — in PPR, there is a big gap between a reliably good tight end and "everyone else." In standard leagues, there are enough consistently good tight ends that this nuance won't matter, but it is important in deep leagues. In deep leagues, it is entirely plausible that all of the consistently good tight ends will be on rosters, and missing out on one could be costly.
Fantasy Implications:
1. Target TE who are red-zone threats: The goal of this article is to focus on issues of scarcity, but the importance of touchdowns overwhelmed anything else related to this position. To consider drafting a tight end in the first half of a draft, he must be a primary red-zone option.
2. Don't miss the tight end run: At some point, a run on tight ends is triggered. In terms of scarcity, just draft a tight end before the run is over. In both standard and PPR, the number of tight ends who are consistently "good" or better is roughly the same as the number of tight ends who are likely to be rostered in a 12-team league. Tight ends who deserve to be drafted consistently outperform those who don't by a significant margin. While that might sound intuitive, it actually only applies to tight ends.
3. In deep standard leagues, draft a serviceable tight end: Item two goes from a gentle recommendation to a crucial necessity in deep standard leagues — 18.4 tight ends per week scored at least four fantasy points per game, and 20 tight ends reached that mark at least half the time. In a 14-team league, or even some 12-team leagues, it is entirely probable that 20 tight ends will be rostered any given week. These low-end tight ends are boring, but consistent — which means not a lot of players move up from below these ranks. If you miss out on a "good" tight end, then you are left with a player who is barely more useful than a bye-week fill-in, without much prospect for improvement off the waiver wire.
A Word About Data
We will use data from the first half of 2016. While that is a small sample, it is necessary.
First, strategies and rules change so frequently in the NFL that the more years considered, the less relevant the data becomes. It's no coincidence the most pass-heavy seasons in NFL history were each of the last four years.
So why not use the last four years? Or even just all of last season? Because doing so would actually present more noise to sift through. Focusing on just the first eight weeks of last season allows us to isolate data that is most useful for draft prep without the noise that comes through a full season's worth of injuries, suspensions and role changes. As the season wears on, players get replaced, and two or three players end up filling a single role — we don't want to double count that role.
For example, let's say a tight end misses half of the season with an injury, and while he is out, his backup dominates. Then when the starter returns, the backup goes to the bench, and the starter dominates. That would give use two tight ends grouped in the "great" tier. But that would be an inaccurate view of the tier. Had the starter never gotten hurt, he would have been the only tight used by his team, and, thus, there would only be one tight in the "great" group. Counting both would be misleading — it gives the appearance of one more "great" tight end than is actually available. No one would draft that back up tight end.
So, by focusing only on half the season, the data becomes more reliable for understanding the "scarcity of high scorers by position." By limiting our data pool, we can limit the number of single roles filled by multiple players.
Also, we're focusing on draft value. If a "great" player emerges late in the season, it doesn't mean much for fantasy drafts. An owner might pick him up a few weeks earlier if he knew he was going to be "great" in, say, Week 12, but no one would have drafted him and clogged his roster for 11 weeks waiting for Week 12.
Fantasy football is a sprint. If your team isn't in contention by mid-season, it's probably not going to rally in time for the rapidly approaching fantasy playoffs. And to be in contention by mid-season, an owner has to have drafted a roster that is competitive early. So, focusing on the first eight weeks is more applicable to draft prep.
Finally, scoring is based on typical leagues: 4/6 points for touchdowns, 25/10 yards per point. (Back to Top)
This article appears in the 2017 RotoWire Fantasy Football magazine. Order the magazine now.