


This article is part of our Rounding Third series.
This is the companion to last week's Hitting Category Targets article. Our goal here is to identify trends in the pitching categories in 5x5 roto leagues, with an eye geared towards overall contests in the NFBC and in TGFBI. We'll look at data from the 15-team NFBC Main Event, 15-team TGFBI (The Great Fantasy Baseball Invitational) and the 12-team NFBC RotoWire Online Championship. Your category targets will vary more in standalone leagues, and certainly more in single-league environments.
Before we dive into the category targets, let's first look at the league-wide pitching trends.
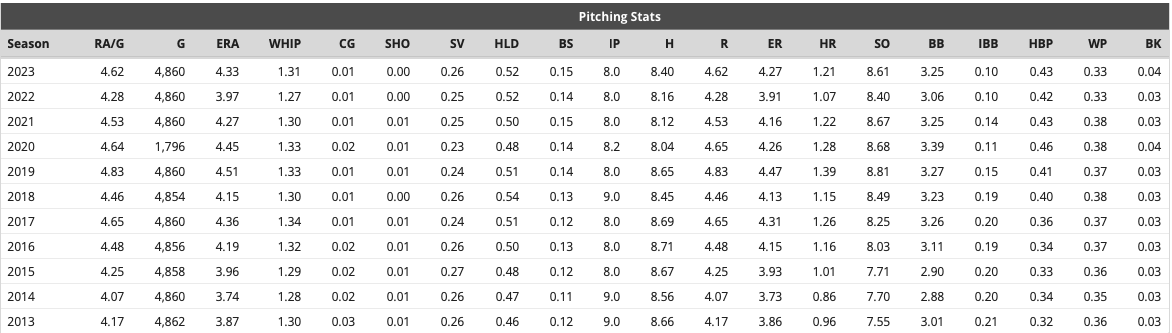
These league-wide trends mirror those on the hitting side, which is no surprise. There are more hits allowed per team per game, at least compared to the previous three years, but only to that point. There was a jump in league-wide ERA and WHIP, but again nothing outlandish or even outpacing the rates from 2020 or the preceding years. With all the advancements on the pitching side of the game, the impact of the rules changes could only go so far.
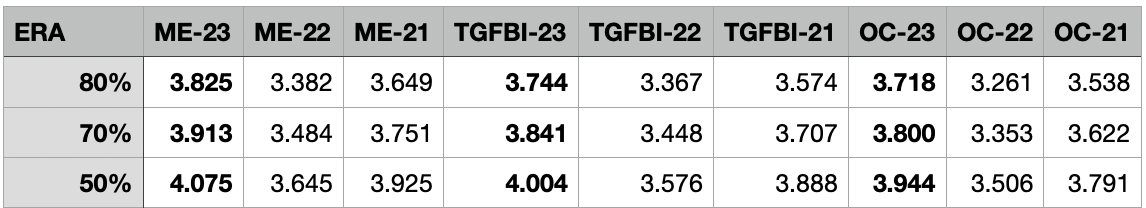
ERA
Teams that do well in ERA often do well in WHIP, and that often correlates to overall success. It should also come as no surprise in overall contests that these teams often succeed in Wins and K's to boot. There are strategies in stand-alone leagues that advocate punting Wins/Strikeouts, or punting ERA/WHIP by pursuing high-strikeout pitchers regardless of their ratios, but the former doesn't work well in overall contests and the latter are exceedingly
This is the companion to last week's Hitting Category Targets article. Our goal here is to identify trends in the pitching categories in 5x5 roto leagues, with an eye geared towards overall contests in the NFBC and in TGFBI. We'll look at data from the 15-team NFBC Main Event, 15-team TGFBI (The Great Fantasy Baseball Invitational) and the 12-team NFBC RotoWire Online Championship. Your category targets will vary more in standalone leagues, and certainly more in single-league environments.
Before we dive into the category targets, let's first look at the league-wide pitching trends.
These league-wide trends mirror those on the hitting side, which is no surprise. There are more hits allowed per team per game, at least compared to the previous three years, but only to that point. There was a jump in league-wide ERA and WHIP, but again nothing outlandish or even outpacing the rates from 2020 or the preceding years. With all the advancements on the pitching side of the game, the impact of the rules changes could only go so far.
ERA
Teams that do well in ERA often do well in WHIP, and that often correlates to overall success. It should also come as no surprise in overall contests that these teams often succeed in Wins and K's to boot. There are strategies in stand-alone leagues that advocate punting Wins/Strikeouts, or punting ERA/WHIP by pursuing high-strikeout pitchers regardless of their ratios, but the former doesn't work well in overall contests and the latter are exceedingly rare. You'll note that the spike in ERA from 2022 to 2023 in fantasy leagues (in all but the 80th and 70th percentile of TGFBI, that jump was over .4 earned runs) outpaces the bump in the league-wide numbers (.36 earned runs). I think that makes sense, as pitchers rostered in fantasy leagues are obviously going to be better than those in the league as a whole. If the pitching environment gets tougher, it's going to have a bigger impact on those we're using more, and those that throw more innings.
WHIP
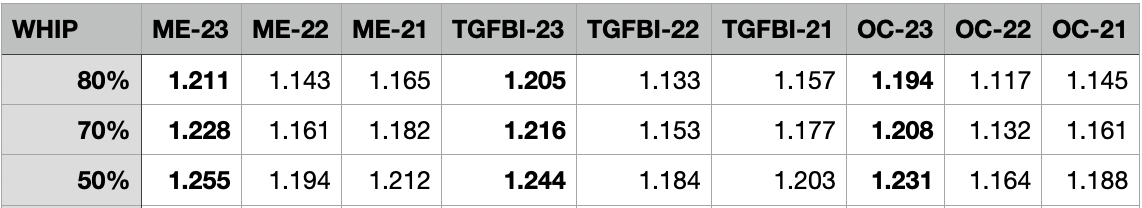
Again, the fantasy-rostered rate of increase in WHIP (around .07 baserunners per inning) significantly outpaces that of the league as a whole (.04 baserunners). Last year's Main Event winners — Brian Slack, Nickolaus Sackett and Dylan White — finished with 790/795 points in ERA and 788/795 points in WHIP. I'd say that correlates pretty well with winning. I'm curious about what happens to league-wide WHIPs and batting averages once/if baseball implements the automated strike zone — who will it benefit?
Strikeouts
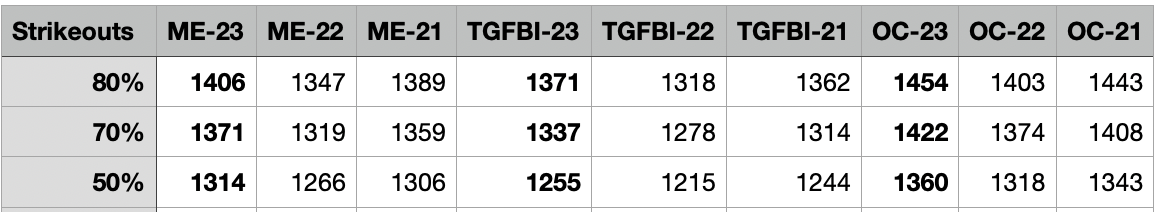
As my friend Joe Sheehan likes to say, "... pitchers are wizards." You can ban or limit shifts, you can speed pitchers up with a pitch clock, you can crack down on grip enhancement, but you can't put the genie back in the bottle when it comes to all the advancements made by pitchers in terms of both velocity and movement. The shift to the universal DH temporarily lowered our strikeout targets and the overall league-wide strikeout rate in 2022, but we were back up last year, albeit not yet to the levels seen in 2018 and 2019. Nonetheless, this game still boils down to a battle over the strike zone, no matter how much the lords the game want more contact.
Wins
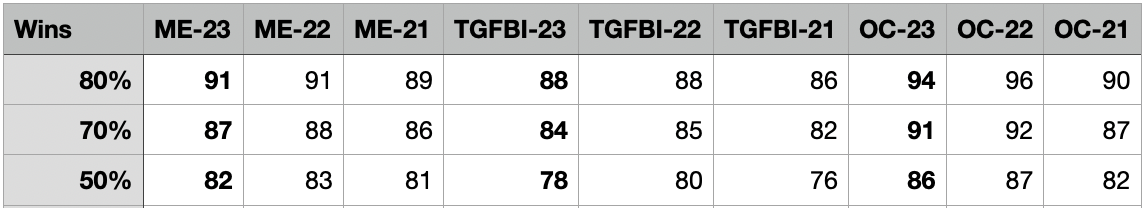
I thought we might see fewer wins needed to hit our targets, but so far I've been wrong about that. My logic was that the average starting pitcher is throwing fewer innings per start, as the notion that most pitchers dramatically decline in performance the third time through the order. If they're not going as deep into games, those starters are earning fewer wins, and thus we're rostering fewer wins. At the very least, however, that latter tenet (us rostering fewer wins) hasn't been true, at least in relation to 2022 and 2021. The 2021 numbers might require stricter scrutiny, however, as that was after a 60-game COVID-racked season in 2020. So many pitchers were limited in their total innings in 2021, especially younger pitchers. For what it's worth, our wins targets were higher in 2018 and 2019.
It's also noteworthy how compact the wins category remains. Three more wins could potentially catapult you to the top of your league's standings, and three on top of that could put you into the overall cash.
Saves
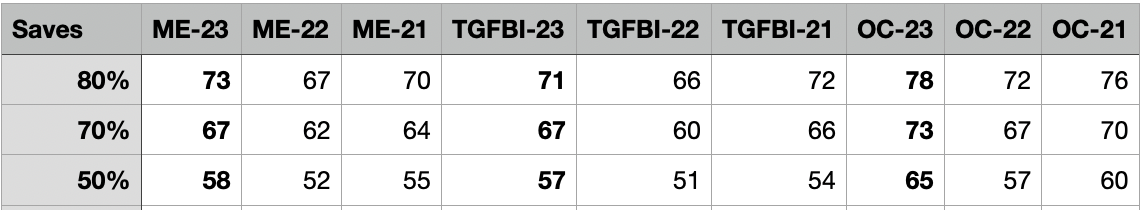
The old saw used to be that you needed to roster 2.5 closers on draft day in a 12-team league, as you wanted to get 80+ saves. In 2018, you needed 88 saves to hit the 80th percentile and 82 saves to hit the 70th percentile. I don't think we'll get to that threshold again, but it's remarkable that our target numbers rose last season. Fewer closers lost their job by injury or performance last season, meaning that we did a better job of rostering those saves. The league-wide save rate is likely to remain stable, even if bullpen usage will vary from year to year. There are some years where I'm comfortable with only 9-to-10 closers as my RP1, but this year that total is closer to 15-to-17, which frequently encourages me to wait an extra round to roster my first closer.
As with stolen bases, those that overachieved in saves frequently didn't benefit in the overall standings, though there were some teams that had Main Event cashes and were in the top-20 overall in saves:
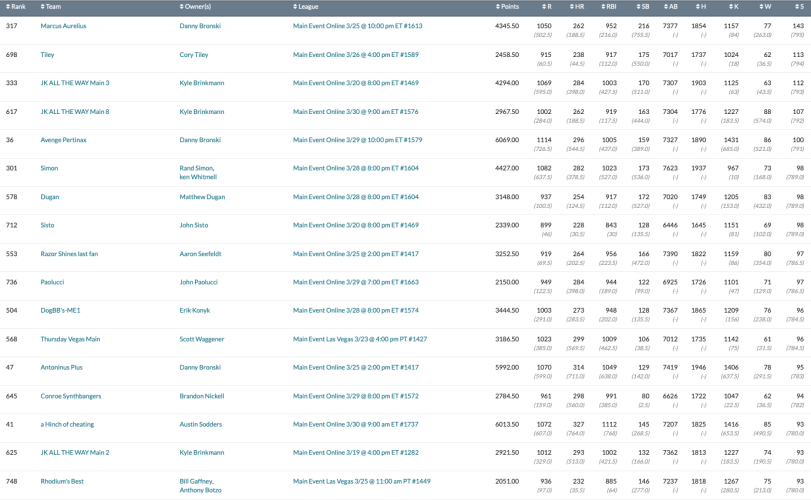
Many of those that went far past the 80th percentile in saves struggled to compete in wins, which seems like a natural correlation.
Also, as was the case with stolen bases, completely punting saves didn't work out very well, with a couple of notable exceptions. First — here were the top overall teams — notice how one top-20 team (The Robot — Phil Dussault) barely registered any saves.
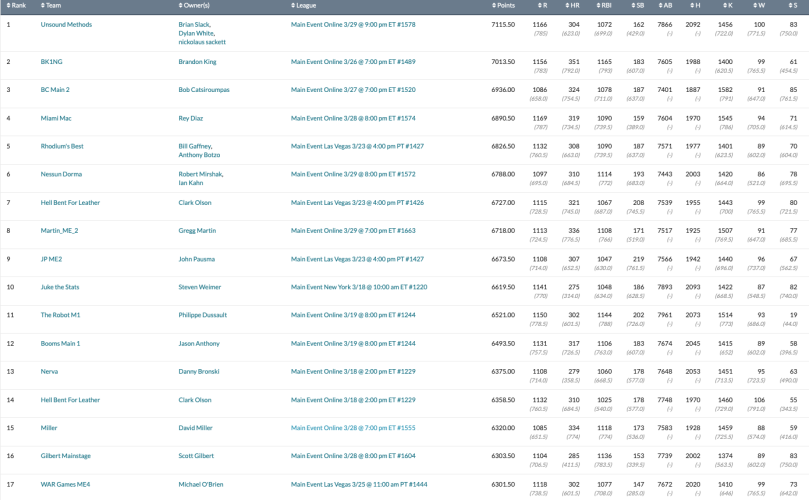
And here's one more way to look at it, with those that absolutely punted saves. Bravo, Dick Temkin, for registering a top-100 finish without logging a single save! He finished second in the league. I finished ... lower in the standings in that league!
Typically I've been tackling the saves category by rostering one top-10 closer, usually in the 6-10 range, though sometimes that's expanded to the 6-15 range instead. I might be inclined in future 15-team leagues to take two closers in that range to avoid some of the bigger FAAB wars that you see over closers. That would require taking two closers in the first 10 rounds, which is still a tough pill to swallow for me. Ideally that means getting two from the group of Paul Sewald, Alexis Diaz, Pete Fairbanks, Evan Phillips, Andres Munoz, Tanner Scott and maybe Clay Holmes. That requires some planning about when to pull the trigger and some serendipity between draft position and league behavior.
Here's where I reassert the caveat that category targets are not sacrosanct, and there are plenty of paths to victory. One should not take the sum of your player projections and assume that you've achieved your goals in that category, for obvious reasons. And these targets matter more in contest leagues with overall standings; it's easier to succeed while punting a category in a standalone league, and it's also easier to achieve category balance via trades in your traditional leagues.


